


Graduating From T-tests to ANOVA

Summary: This article highlights the importance of the ANOVA statistical analysis in understanding complex user interactions. It includes real-world scenarios and a how-to tutorial at the end.
I worked at Minitab, the world's most powerful desktop statistical software package, for almost nine years. Although I don't consider myself particularly math-minded, I learned a lot during my time there that I still use to this day. One of those things is moving from the foundational analysis provided by a t-test to the more comprehensive approach of ANOVA, which is a critical step for addressing complex user data questions.
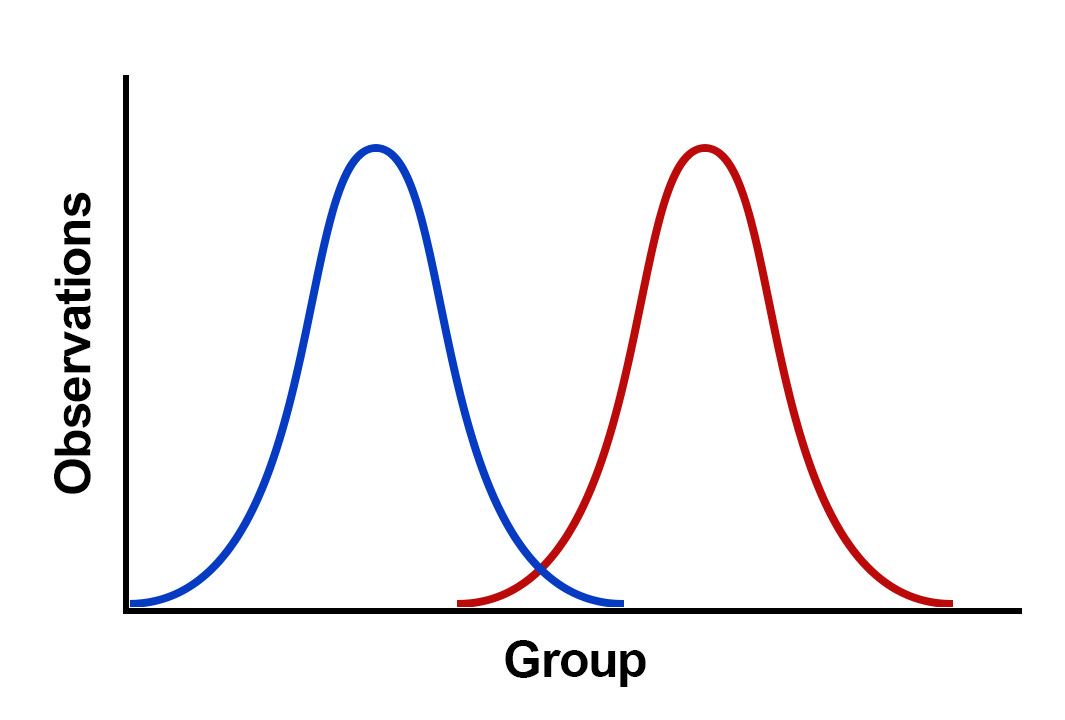
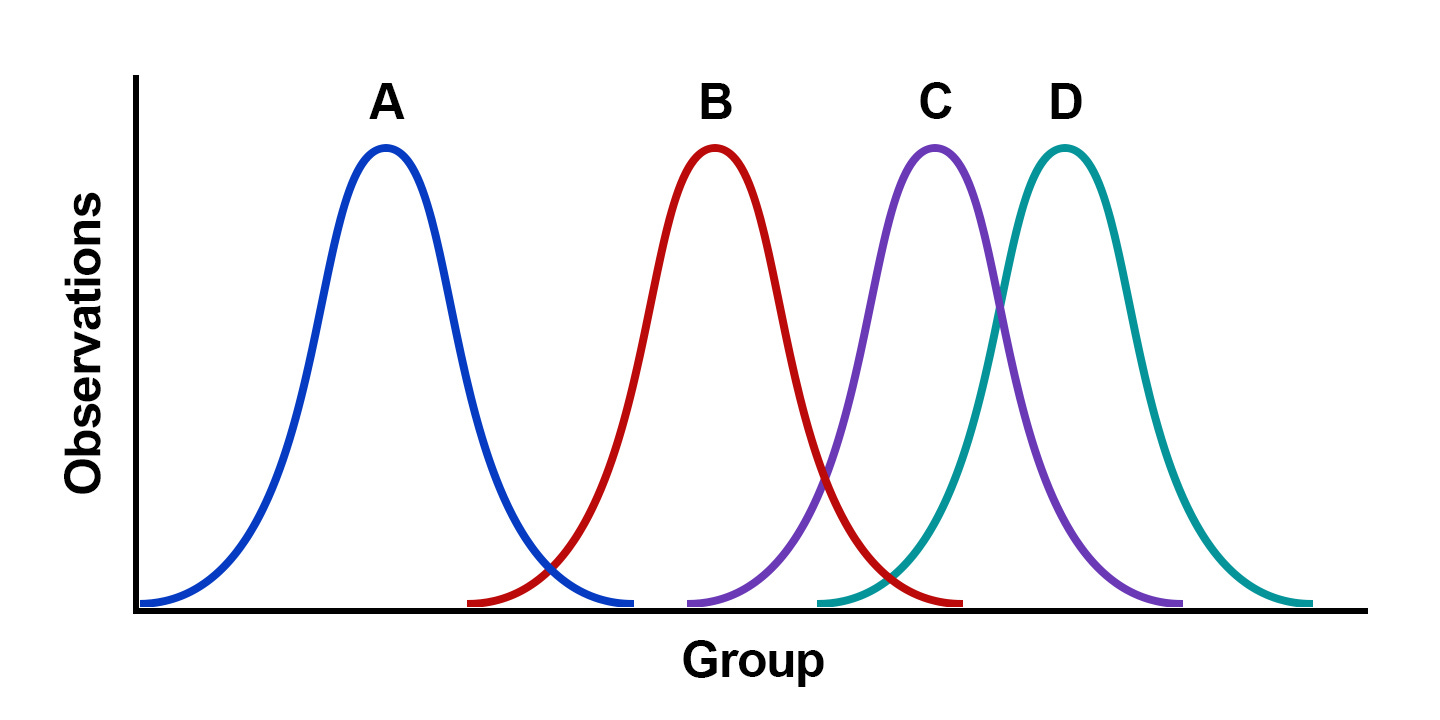
While the t-test efficiently compares the means between two groups, ideal for assessing things between two interface versions, ANOVA broadens this capability, allowing researchers to compare multiple groups simultaneously. This transition is particularly relevant in scenarios like those faced by UX researchers at large tech companies, where understanding nuanced user interactions across diverse demographics is critical.
For example, when evaluating how interface changes affect user engagement across various age groups, ANOVA not only facilitates comparisons across these multiple groups but also uncovers the interaction effects between different factors, such as age and device type. This shift from simple comparisons to a more well-rounded analysis underscores the necessity of embracing ANOVA in UX research, offering a deeper, more nuanced understanding of user preferences and behaviors that goes beyond what the t-test can provide.
In this post, I'll lay out a real-world scenario and give a tutorial on how to run an ANOVA analysis on your own data.
Why ANOVA in the First Place?
ANOVA stands out for its ability to handle complexity effortlessly. It's not just about comparing two groups; it's about exploring the multifaceted interactions within your data across many groups simultaneously. This method is particularly valuable when assessing the impact of new features or changes across different demographics or user behaviors. Imagine you're tasked with evaluating how a redesigned interface affects user engagement across various age groups. ANOVA lets you pinpoint whether the changes foster engagement uniformly across all demographics or if certain age groups respond differently.
I love this example because it's the kind of question stakeholders ask all the time, and the data often unearths some unintuitive new findings.
Real-World Scenario
Imagine Meta has rolled out a new interface designed to enhance user engagement. Given its diverse user base, Meta's UX team needs to ensure that the redesign resonates across age groups.

By applying ANOVA, researchers can compare user engagement metrics, like time spent on the platform and interaction rates, across different age groups both before and after the interface update. This analysis not only reveals if the redesign was effective but also highlights which demographic groups saw the most significant impact, offering valuable insights for future design decisions.
Conducting ANOVA Analysis: A Step-by-Step Guide
Executing an ANOVA test is easy, thanks to various software tools designed to simplify statistical analysis. Here's a brief overview of how I conduct an ANOVA analysis across some of the most popular platforms:
R
Step 1: Prepare your data - Ensure your data frame ('df') has a factor column representing your groups (e.g., age groups) and a numeric column for the dependent variable (e.g., engagement score).
Code Snippet
df <- read.csv("your_data.csv") # Load data
df$group <- as.factor(df$group) # Convert group column to factor
Step 2: Run ANOVA
Code Snippet
result <- aov(engagement ~ group, data = df)
summary(result)
Step 3: This code performs ANOVA using 'engagement' as the dependent variable and 'group' as the independent variable, then prints the summary of the ANOVA table.
STATA
Step 1: Load your data - Use the 'import' command to load your dataset.
Code Snippet
Import excel "your_data.xlsx", first row clear
Step 2: Run ANOVA
Code Snippet
ANOVA engagement group
This command conducts an ANOVA analysis with 'engagement' as the dependent variable and 'group' as the factor.
SPSS
Step 1: Import your data - Use the "Open Data" option to load your dataset into SPSS.
Step 2: Run ANOVA
Go to 'Analyze' > 'Compare Means' > 'One-Way ANOVA'
Move your dependent variable (e.g., 'engagement') to the "Dependent List" box and your factor (e.g., 'group') to the "Factor" box.
Select the "OK" button to run the analysis.
Minitab
Step 1: Prep your data - Import your data into Minitab. Ensure your column data types are set correctly (numeric for engagement scores, categorical for groups).
Step 2: Run ANOVA
Go to 'Stat' > 'ANOVA' > 'One-Way...'
In the dialog box, choose your dependent variable (e.g., 'engagement') for "Response" and your grouping variable (e.g., 'group') for "Factor".
Select the "OK" button to run the analysis.

NOTE: For all these tools, the output will include the F-statistic, p-value, and sometimes additional information such as mean squares and between-group variances. The p-value is what you are looking for in the results: a low p-value (typically <0.05) indicates that there are significant differences between your groups' means. Remember, the specific steps might vary slightly depending on your software version and the details of your dataset.
Common Pitfalls to Avoid
While ANOVA is a powerful tool, it's not without its challenges. One of the main pitfalls to watch out for is the temptation to draw conclusions from p-values alone without considering the practical significance of your findings. Additionally, ensuring your data meets ANOVA's assumptions, like the independence of observations and homogeneity of variances, is crucial for accurate results. Lastly, when comparing multiple groups, the risk of Type 1 errors increases, necessitating adjustments like the Bonferroni correction to maintain the integrity of your conclusions.
Conclusion
I hope this article persuades you to take the leap from t-test to ANOVA when appropriate. This progression from comparing two groups with a t-test to examining multiple variables with ANOVA allows us to grasp the full spectrum of user interactions. For UX researchers, this means being able to uncover how changes impact diverse user groups in more detail than ever before. ANOVA doesn't just add depth to our analysis; it transforms data into a roadmap for creating digital experiences that resonate with users from all walks of life. So, if you are looking to refine your skills, adopting ANOVA is your next step toward making more informed, user-centered UX decisions.