


R for UX Researchers Series Wrap-up
An Article For Sharing With UXRs

Summary: This article serves as a landing page for the "R for UX Researchers Series." It provides links, key metrics, and an analysis of the series' impact within the world of UX research. Toward the end, I outline future plans and express my gratitude to the readers and subscribers who made this series such a huge success. Thanks, everyone!
Over the last 13 weeks, I've dedicated this blog to a series of tutorials designed to help UX researchers get up and running with R and RStudio. The idea is that if readers go through all the articles in order, they will have learned almost everything they need to start using R and RStudio with their own projects. I call this the “R for UX Researchers Series.” It's been tough at times, but looking back, it's been totally worth it. I've made new friends, helped some readers with real-world UX problems, and got a bunch of new researchers using R in their everyday practice.
Knowing this should give you confidence that you can do it, too!
UX research data analysis doesn't require expensive software or a PhD in statistics.
To wrap up the series, I'm writing this article as a sort of landing page. Feel free to share this link with anyone interested in learning R and RStudio using real-world UX research scenarios and real user data.
The Articles In Order
Here are the 12 tutorials that make up the “R for UX Researchers Series.” I encourage you to start with tutorial one and go through the rest sequentially. Readers have told me they don't take long to get through and are pretty easy to follow.
Product Bundling and Recommendation Engines with Market Basket Analysis
Fraud Detection Using Machine Learning with Random Forest Modeling
Prioritizing Features with MaxDiff Analysis (Reader Requested)
Real-World Data Cleaning (Reader Requested)
Creating Reports with RMarkdown (Reader Requested)
R for UX Researchers Breakdown
Since this article marks the end of the series, I thought it was only fitting to share some data about it. Of course, I did, right? Hahaha!
Basic Stats
✏️ NOTE: Metrics as of Aug. 2, 2024.
The average tutorial length was ∼3,720 words.
The tutorials garnered 4,764 total views.
Readers shared the tutorials 84 times.
The series started with 113 subscribers and ended with 210 subscribers, which is about a 46.19% increase.
"Getting Started with R & RStudio" was the readers' favorite article. It garnered 24 new subscriptions, 1,230 views, and 33 shares.
Huge thanks to all the new subscribers!
Deeper Analysis
Traffic Overview:
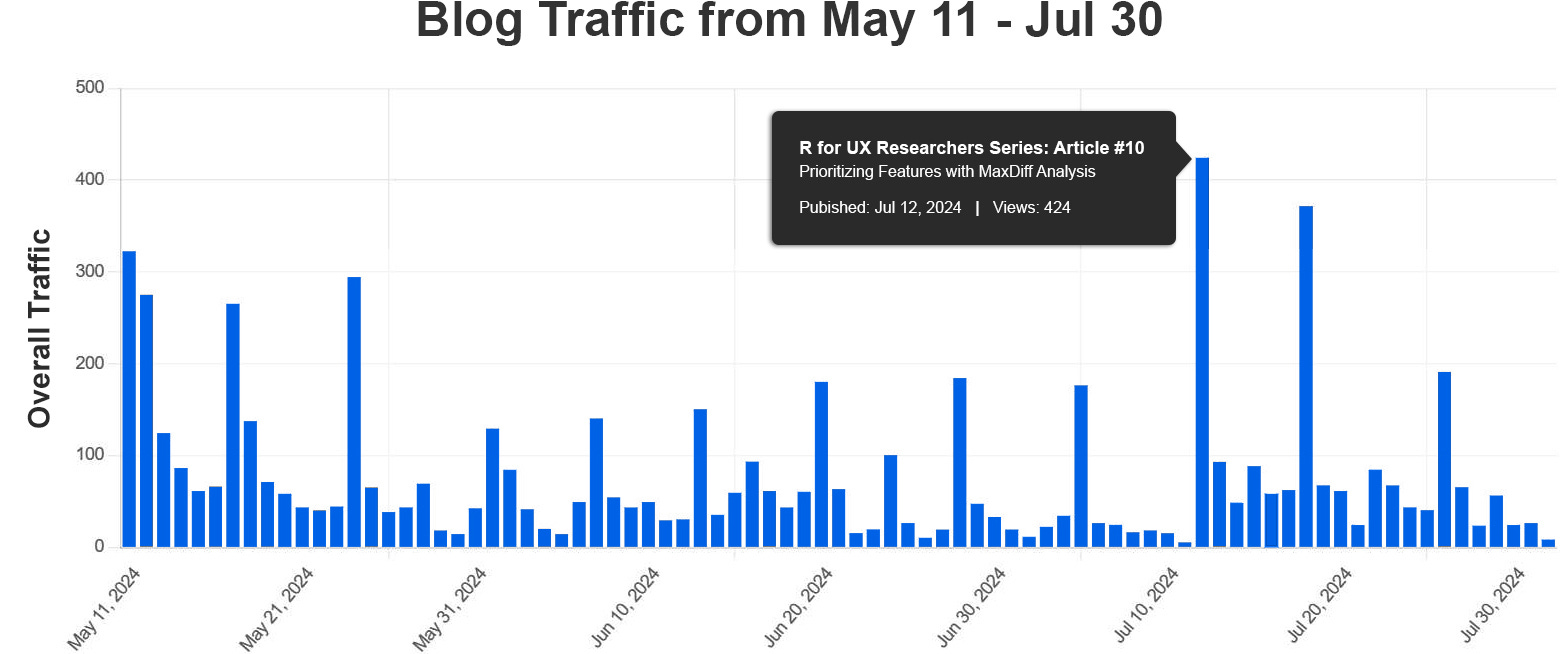
📘 Explanation: The overall traffic data shows a strong start, with notable peaks throughout the series. The most significant spike was on July 12, the date I published "Prioritizing Features with MaxDiff Analysis." This makes sense because a bunch of people reached out to me about this one, and it was a reader-recommended topic.
Scatter Plot of Shares vs. Total Views:
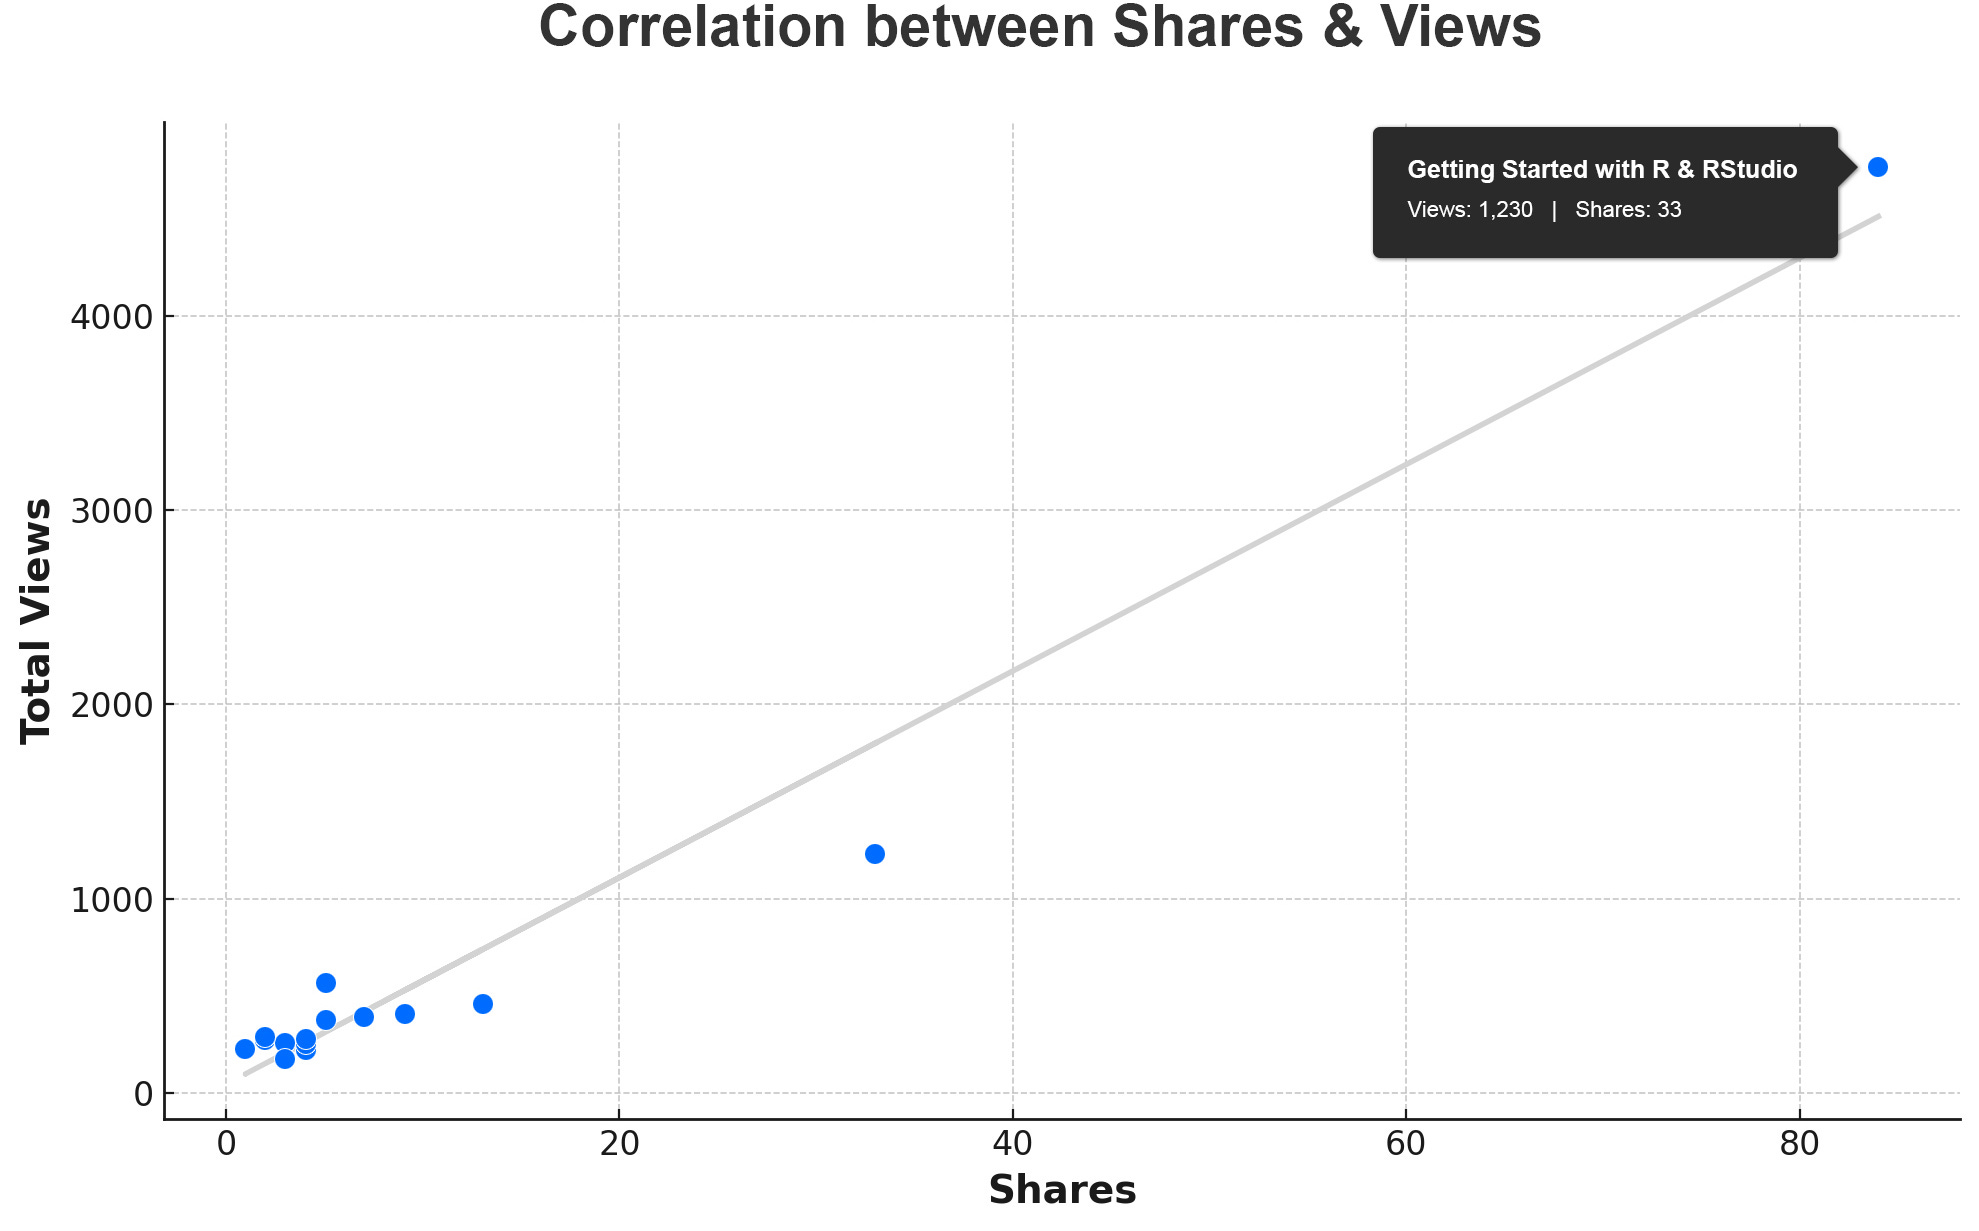
📘 Explanation: This scatter plot clearly illustrates a strong positive correlation between the number of shares and the total views. In other words, the more the tutorials were shared, the more people viewed them. This seems like a "no duh" finding, but it's a good reminder of the power of word-of-mouth and social sharing in driving traffic.
Big thanks to everyone who shared these tutorials! You are the main reason the series has been able to help so many UX researchers.
Metrics Correlations:
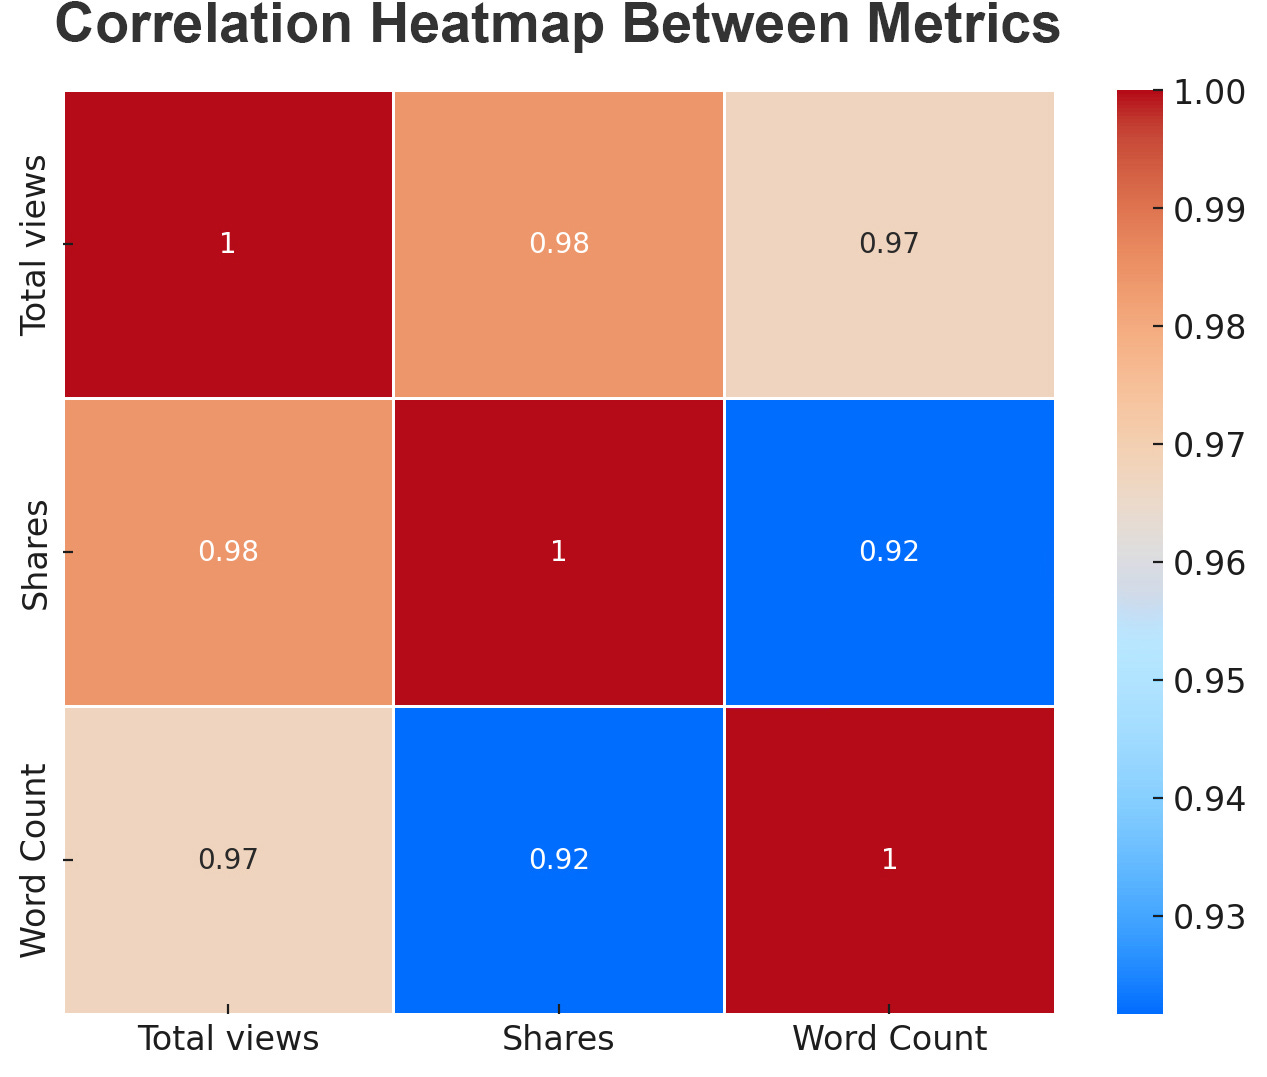
📘 Explanation: The correlation heatmap gives us an overview of how different metrics are related. We can see a high correlation between total views and shares, as well as between total views and word count. This suggests that longer tutorials were often more detailed and informative, leading to more shares and views.
This provides some evidence that my initial vision for this Substack was on point: there actually is an audience looking for detailed, long-form content that can genuinely help advanced UX researchers deepen their skills and think critically about our craft. This contrasts with the shallow, clickbaity, 200-words-or-less content spread by many so-called 'UX influencers' today.
These insights are not just numbers; they're a testament to the series' success and impact. It's been a fun ride seeing the positive feedback and engagement from all of you. Let's keep this momentum going as we explore more exciting topics in the future!
Conclusion
Well, that's it, that's the wrap-up. Again, I want to give a huge shout-out to all of you who have engaged with the articles in this series. I'm so glad it helped so many of you, and I hope the series will continue to help more people in the future.
I wrote these to be evergreen, so please keep sharing if you think others would benefit!
I'll be transitioning back to the types of articles I was writing before starting the “R for UX Researchers Series.” Keep an eye out for topics like:
Methods for quantifying qualitative data
Mixed-methods and triangulation
Using Excel and Google Sheets for simpler analysis
Thoughts on AI in UX research
Book reviews and more
But don't worry, I'll still write about R and RStudio when appropriate, and the more you all request stuff, the more likely I'll write about it. So keep the comments, DMs, and emails coming!
Thanks again; I couldn't do it without each and every one of you!
Hey Trevor - btw the link to the data cleaning article in the list of links leads to this article