

Statistically Significant or Not?
Common Quant Misconceptions

Summary: I’ve noticed a common misconception in quant research that an entire study is considered either statistically significant or it is not. This article explains why statistical significance applies to individual findings within a study, not to the study as a whole. It details how effect size, variability, sample size, and confidence level work together to determine whether a particular finding reaches an orgs statistical threshold.
A little while ago, I was talking with a UX researcher from another company who had been working in the field for about 8 or 9 years. He had a ton of experience with different research methods and described himself as knowledgeable about quant research. He even used the mixed-methods moniker to describe his work a few times during our conversation.
Specifically, we were discussing a quant study he had recently completed and whether the sample was large enough to support the findings. (Sound familiar? Hahahaha) Early in his career, he had been taught that an entire study was either statistically significant or it was not. That idea shaped the question he asked me during our conversation. Was the study statistically significant? His confusion was not caused by a lack of research experience or a broad unfamiliarity with quant methods. It came from treating statistical significance as a label for the entire study rather than something applied to individual findings within it.

I then explained that statistical significance usually applies to a specific result within a study. One comparison may meet the statistical threshold while another comparison from the same study may not. Both results can come from the same participants, the same survey, and the same overall sample.
The researcher then asked the question that revealed the real source of the confusion. If the sample size stayed the same, how could one result be statistically significant while another was not? To answer that, we needed to look beyond the number of participants. We needed to discuss the size of each result and the amount of variation in the data. That’s the catalyst for this week’s post.
Statistical Significance
The value of statistical significance is that it helps us judge whether an observed result is unlikely to be explained by normal sampling variation alone and may reflect a real pattern in the broader population. It usually applies to one specific comparison, difference, or relationship in the data, not to the entire study.
Suppose we compare 2 versions of an experience and observe a difference in task-completion rates. A statistical test helps us evaluate how unusual a difference that large would be if there were no real difference between the designs in the broader population. When the evidence meets the threshold selected for the research, we call that particular result statistically significant. That conclusion is narrower than many people realize.
A survey with 10 important findings could contain 3 results that meet the statistical significance threshold and 7 that do not. Somehow, this fact was missed in the training of many UX research pros, and I say it is time we self-correct.
This distinction matters because statistical significance does not tell us how large or useful a finding is. In fact, the American Statistical Association has warned researchers against treating statistical significance as a measure of the size or importance of an effect. The observed difference, uncertainty, research design, and practical consequences all need to be considered together.

In my last 5 orgs, I advocated for using a 90% confidence level for our quant research. Compared with a 95% confidence level, this accepts slightly more uncertainty and can reduce the sample size required to achieve the same level of precision, making it a practical tradeoff among confidence, recruiting effort, time, and cost. A 95% confidence level is the most commonly used convention across many research fields, including academia. Higher-stakes research may require different or stricter standards, but the appropriate threshold should reflect the decision being made and the relative consequences of false positives and false negatives. But for my orgs, at those points in time, 90% was a better, more practical default. I made sure everyone understood the tradeoffs and socialized the idea before any studies were run.
⚠️ Disclaimer: Of course, I reserved the right to use, and often did use, a higher and more rigorous confidence level for specific high-impact studies.
Every org is different, and you’ll need to determine the appropriate threshold based on your specific situation. And keep in mind, using a 90% confidence standard does not make every finding in a study statistically significant by default. It simply establishes the threshold your org will use when evaluating each result.
You need to work with your stakeholders upfront to agree on your org’s default confidence threshold. Establishing that standard places the burden of proof on anyone who later argues that a larger sample was required for a particular study.
An org-wide standard also makes research decisions more transparent and collaborative. It prevents researchers from keeping the reasoning behind sample-size decisions to themselves. If a stakeholder questions a study’s validity based on a common sample-size misconception, you can refer back to the standard everyone agreed to before the research began. As a best practice, the threshold should also be selected before analyzing the data because changing it after seeing the results would allow the desired outcome to influence the analytical standard.
Effect Size
Once we cleared up the idea that significance applies to individual findings, the rest of the conversation became wayyyyyyy easier. The concept that resolved the confusion was effect size.
Effect size describes how large an observed difference is. For example, a 2-percentage-point change in task completion is a much smaller effect than a 20-percentage-point change. Larger effects are generally easier to distinguish from normal variation, while smaller effects usually require more participants to evaluate confidently.
For example, consider a study comparing 2 versions of the same GUI. One result shows that average satisfaction increased from 5.1 to 5.2 on a 7-point scale. Another result shows that task completion increased from 55% to 85%.
Both findings came from the same study and the same group of participants. The difference in satisfaction is very small, while the difference in task completion is much larger. The completion result may meet the statistical threshold even when the satisfaction result does not. Is this all making more sense now?
The exact answer would also depend on how consistent the responses were and which statistical test was appropriate.
4 factors work together when we evaluate a quant result:
Sample size: How much information the study contains
Effect size: How large the observed difference is
Variability: How consistent or spread out the results are
Confidence level: How much uncertainty the study is willing to accept
Sample size matters, but it cannot answer the question by itself. Two findings from the same sample can produce different statistical conclusions because the effects and the amount of variation may be different.

This is where the common recommendation of 30 participants often causes confusion. MeasuringU addressed this issue masterfully in its article, “Do Statistics Really Require 30 Participants?” That article explains that 30 is not a universal minimum for conducting statistical analysis. Statistical methods can be used with smaller samples, although small samples usually provide less precision and make smaller effects harder to detect.
A sample of around 30-32 respondents can sometimes be enough for a quant UX study, particularly when the org uses a 90% confidence standard and the observed effect is large. That same sample may provide strong evidence for one result while leaving several smaller differences inconclusive.
And remember, a result that does not meet the statistical threshold can still provide useful information. We all know this to be true, but the term statistical significance often confuses people and muddies the waters, making the problem even worse. It may suggest a possible direction, support evidence from another research method, or show that a larger sample would be needed before making a confident claim.
The key is to report each result accurately. We should explain what we observed, how large the effect was, whether it met the statistical threshold, and whether the difference is large enough to influence a decision.
That was my answer to my researcher friend’s original question. The sample size did not make the entire study statistically significant or insignificant. It gave us a certain amount of information, and each result had to be evaluated based on the size of the effect, the variation in the data, and the confidence standard we had selected.
Different Methods, Different Samples
The conversation also reminded me why sample-size guidance becomes confusing so quickly in UX research. We use the term UX research to describe methods that answer very different questions, so the same sample-size logic cannot be applied to all of them.
Christian Rohrer’s framework organizes UX research methods in a 2 × 2 matrix, which I absolutely love. One dimension separates what people say from what people do. The other separates qual understanding from quant measurement.
I’m sure you’ve seen this before in Christian’s Nielsen Norman Group article, ”When to Use Which User-Experience Research Methods”:
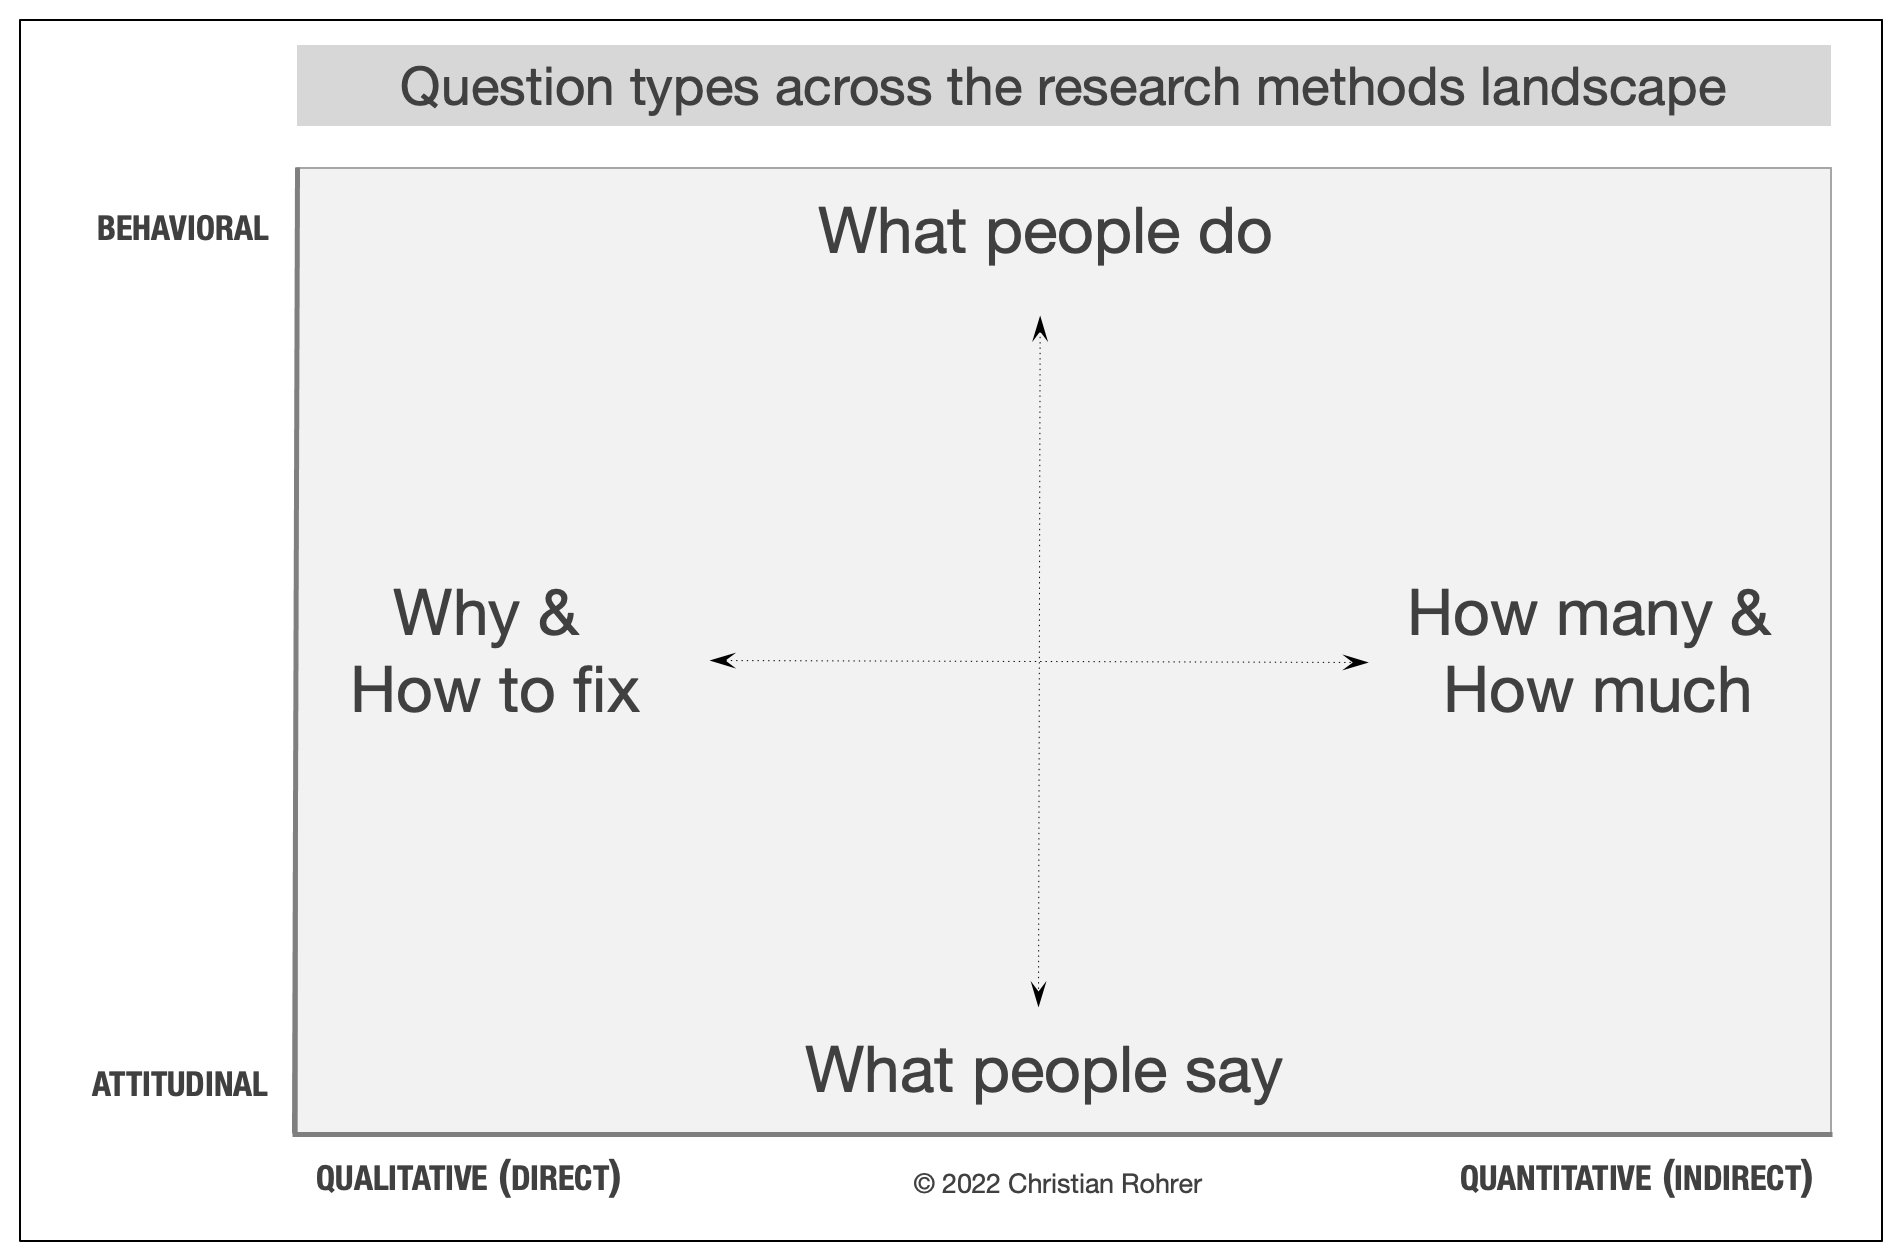
Qual Attitudinal
For qual attitudinal research, I usually think about data saturation rather than statistical significance. Data saturation occurs when new interviews mostly repeat themes we have already heard and stop changing our understanding in a meaningful way.
The results from this type of research are often directional. They can give us enough evidence to make a reasonable decision or identify what should be investigated next, but they do not tell us exactly what percentage of the full population holds each opinion.
Qual Behavioral
Qual behavioral research follows different logic. For example, in a moderated usability test, the purpose is often to find interface problems that the team can fix. A large sample is usually unnecessary when that is the research objective.
That means it doesn’t matter if only 1 of 8 participants cannot find the button needed to complete an important task. The session does not tell us how frequently the full user population will encounter a usability problem, but that’s because frequency and severity are separate considerations. When you find a usability problem in a qual behavioral research study, you fix it no matter how many participants encountered that problem.
Quant Attitudinal and Behavioral
The 2 quant quadrants are where statistical significance becomes more relevant. Even within these quadrants, the type of question affects what we can measure, compare, and conclude.
Remember the earlier example comparing two versions of the same GUI. Satisfaction increased from 5.1 to 5.2, while task completion increased from 55% to 85%. The same participants produced both results, but the much larger difference in task completion was more likely to meet the statistical threshold.
This shows why different types of quant data need to be interpreted differently:
Rating scales let us compare how people evaluated an experience. We need to consider both the difference between the ratings and how much individual responses varied.
Rankings show the order in which people preferred several options. They do not tell us how much more the first-ranked option was preferred over the second.
Behavioral measures let us compare results such as task completion, errors, time on task, and conversion. Each measure must be analyzed separately because the size and consistency of the differences may vary.
Open-ended questions still produce qual data, even when they appear in a large survey. We can categorize and count the responses, but statistical significance does not apply directly to the original written comments.
This brings us back to the main point from earlier.
A single quant study can produce strong statistical evidence for one comparison and much weaker evidence for another. That is why an entire survey, benchmark, or experiment should not be given the overarching label of statistically significant.
How I Report Mixed Results
Once we accept that significance applies to individual results, reporting a quant study becomes more specific. Instead of announcing that the study was significant, I describe what happened for each important measure.
For every major result, I try to report four things:
What we observed: The scores, percentages, or differences found in the sample.
How large the effect was: The actual size of the difference between the results.
How confident we are: Whether the result met the statistical threshold and how much uncertainty remains.
Why the result matters: Whether the difference is large enough to affect a user or business decision.
A report might explain that participants completed a task more often with Design B and that the difference met our 90% confidence threshold. The same study might show a small improvement in satisfaction that did not meet the threshold.
Those findings should be reported separately. The task-completion result may provide strong enough evidence to influence the decision, while the satisfaction result may remain directional or require a larger sample. For example, a result that does not reach statistical significance still contains valuable information. The observed difference may suggest a direction, support findings from interviews or usability testing, or help the team estimate the sample needed for another study.
The language used to report that result matters. Saying that there was no difference makes a stronger claim than the data may support. A more accurate explanation would say that we saw a difference, but we did not have enough data to know whether it reflected a real pattern or just normal real world variation in the results.
Statistical thresholds should support the interpretation rather than replace it. Again, the American Statistical Association advises against making scientific, business, or policy decisions based only on whether a result crosses a statistical threshold. The study design, effect size, assumptions, uncertainty, and consequences of the decision all contribute to the conclusion.
Conclusion
By the end of our conversation, the researcher I was talking to no longer needed one answer about whether the entire study was statistically significant or not. We could now look at each important finding and discuss the effect size of the result, the amount of uncertainty, and whether the evidence was strong enough to support a decision.
The bottom line is that a study with only 32 respondents may produce statistically significant findings when the effects are large, while smaller effects within the same study may remain statistically unresolved and be treated as directional.
If you take away only one thing from this article, it should be this:
Increasing the sample size can improve precision and make smaller effects easier to detect, but no participant count automatically makes every finding statistically significant.
The most important analytical skill in this situation was knowing that statistical significance describes evidence for a particular result. Effect size helps us understand how large that result is, and our research context helps us decide whether it matters.
I hope this help clarify things. As always, thanks for reading.