Getting Started with R & RStudio
Tutorial: The UX Research Tool We All Should Know
Summary: This article is an easy-to-follow tutorial that guides you through setting up RStudio and using R to conduct your first statistical analysis and data visualization. It's packed with straightforward steps and practical tips to help you quickly master the essentials of using RStudio in the real world.
Many of you already know I worked for Minitab, the world's most sophisticated desktop statistical software company, for almost nine years. Because of this, I am a long-time Minitab user. (Shocker, hahaha.) I've always appreciated Minitab's straightforward interface and the ease of conducting complex statistical analyses. However, I've been using RStudio more lately. (Don't tell my former coworkers! Hahaha.)
Why did I switch, you ask? Well, unlike Minitab, which is super expensive, using R and RStudio is entirely free, and I like free stuff. It also lowers the barrier to entry for others looking to upskill their stats game. In this article, I'll give you a crash course on how to get started using R and RStudio in the real world.
Article Update (8/2/24)
This article was so well received that I decided to expand it into a full series. I’ve written 12 tutorials, including this one. Below is the order I recommend for going through each tutorial:
Getting Started with R & RStudio (This article)
Product Bundling and Recommendation Engines with Market Basket Analysis
Fraud Detection Using Machine Learning with Random Forest Modeling
Prioritizing Features with MaxDiff Analysis (Reader Requested)
Real-World Data Cleaning (Reader Requested)
Creating Reports with RMarkdown (Reader Requested)
What is R Anyway
I like to think of RStudio as my research partner, one that's exceptionally good at organizing messy big data. Here are the primary ways I use R:
Data Visualization: R is excellent for creating detailed and customizable visualizations, thanks to the 'ggplot2' data viz package (I'll talk about how to use packages later). I use R all the time to generate graphs and charts that illustrate user behaviors, preferences, and patterns.
Statistical Analysis and Modeling: Like Minitab, R excels at statistical analysis, offering an array of standard statistical tests, models, and techniques. This includes regression analysis, ANOVA, and cluster analysis, which are vital for understanding relationships within the data, segmenting users, and predicting user behavior based on various design changes.
Survey Data Analysis: R provides powerful tools for analyzing survey data. Packages like 'survey' and 'likert' are particularly useful for handling complex sample designs and analyzing Likert scale data that I encounter in my day-to-day work.
Dealing with Large Data Sets: With its ability to handle large datasets, R is great for analyzing log data from websites or applications to track and analyze user interactions. This includes sequence analysis, path analysis, and time series analysis, all of which can reveal how users navigate through a product and where they encounter issues over time.
Reporting and Sharing Insights: 'RMarkdown' and 'Shiny' are tools within R that allow me to create interactive reports and dashboards. These tools are excellent for any UX researcher looking to compile data in a way that stakeholders can easily share, understand, and explore while providing interactivity.
But let's not put the cart before the horse, you'll need R installed first.
Installing R and RStudio
This is a 2 step process:
Step 1: Install R
Head over to the official R project website. Whether you're a Windows, Mac, or Linux user, follow these steps to get R rolling:
Mac OS X: Choose "Download R for (Mac) OSX." Grab the latest version, open the .pkg file, and drag R into your Applications folder.
Windows: Hit "Download R for Windows," opt for the base version, and follow through with the default installation steps.
Linux/Ubuntu: Click "Download R for Linux," select Ubuntu or your specific distribution, and follow your system's installation method.
Step 2: Install RStudio
Once R is up and running, download RStudio from this downloads page.
RStudio's Interface
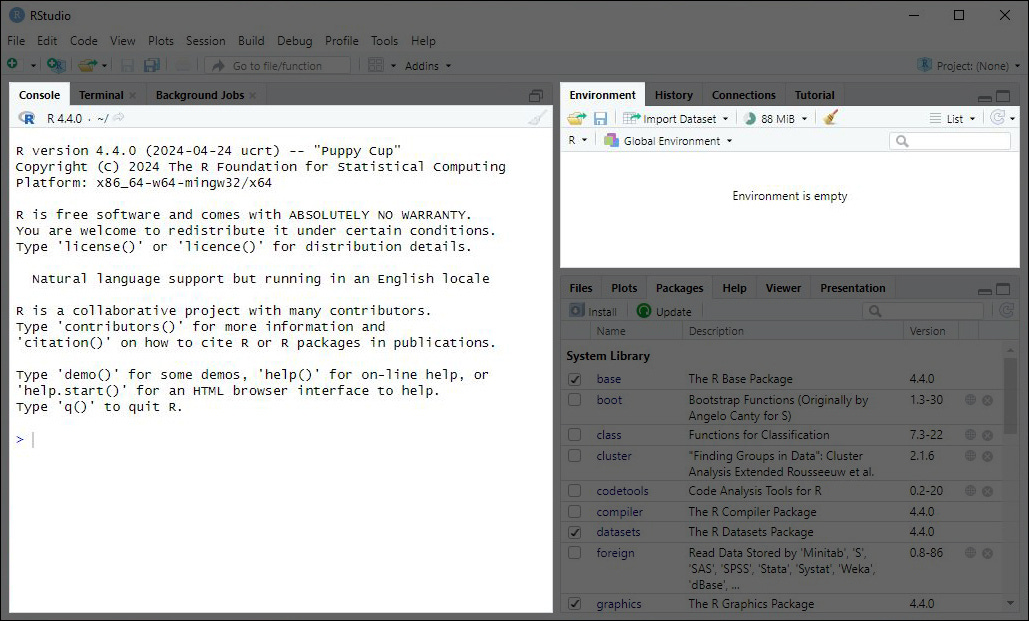
When you fire up RStudio, you'll see something that looks like this.
Here's a quick tour:
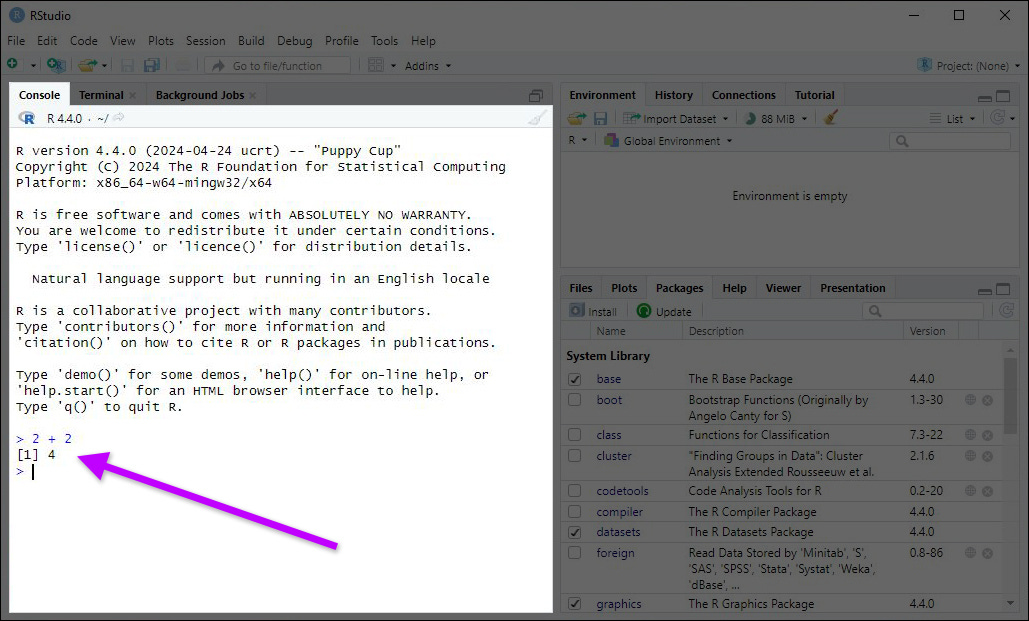
The Console: This is where you can see results instantly. Try it out by typing
2 + 2and pressing Enter to see R in action.The Environment: It's the backstage area where all your variables and data frames will be stored and displayed. You'll see everything you create, load, or import here.
The Console and Environment In Action
Console: In the Console, type in
outcome <- 2 + 2. You just created your first variable called outcome that holds the value of 4.Environment: All your active data objects, including variables, are displayed here. It's your data sandbox.
Packages: Using the Tidyverse
R packages are like add-ons, and you'll need packages to get the most out of RStudio. The first group of packages you should install is called the Tidyverse. Tidyverse is a suite of tools geared towards data manipulation, visualization, and more. Here's how to get started:
Install Packages: In the Console, type
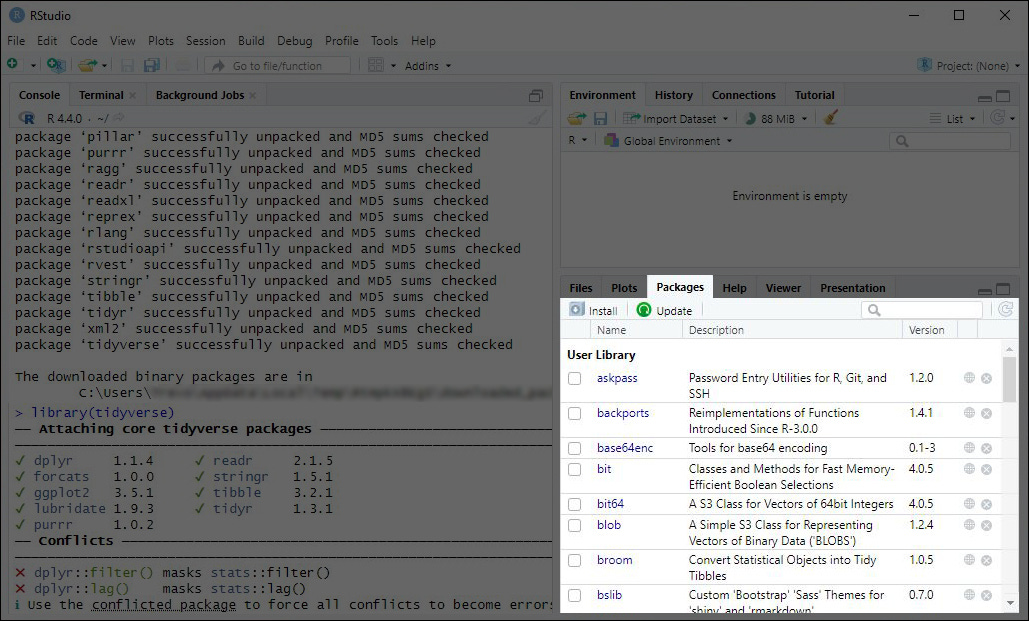
install.packages("tidyverse")and hit Enter to install Tidyverse.Loading Packages: The Tidyverse packages can be activated in a single step. Simply type
library(tidyverse)in the Console and hit Enter to load all Tidyverse packages. You have to do this because packages must be loaded into your computer's memory for each session you run in RStudio. This is how you’ll load all packages, not just the Tidyverse packages. You do this by typing inlibrary()function.
NOTE: Don't worry about the Conflicts section at the bottom of the Console. Select the “conflicted package” link to read more on conflicts.
What's in the Tidyverse
It's all about the packages, baby! Here are the core packages included in the Tidyverse:
readr: Simplifies reading structured data files such as CSVs and text files.
ggplot2: Provides a powerful system for creating data visualizations.
dplyr: Focuses on data manipulation tasks such as filtering rows, selecting columns, and arranging data.
tidyr: Aids in tidying data, making it easier to transform and reshape your data structures.
purrr: Enhances R's functional programming capabilities, particularly when working with lists and vectors.
tibble: Introduces a modern take on the data frame, offering a more robust, user-friendly approach to data manipulation.
stringr: Facilitates string operations, making it straightforward to manipulate strings.
forcats: Deals with categorical variables, providing tools to manage factor variables effectively.
Double-Checking and Help
To check which packages you have loaded, refer to the Packages tab in the pane at the bottom right of the Console.
Select the Help tab at the bottom right of the Console to get general help on RStudio and any specific packages that have been loaded. This tab is an excellent resource for contextual knowledge when starting out and learning.
RStudio Projects for Organized Workflow
RStudio's Projects feature is crucial for maintaining organization while handling multiple analyses. This functionality consolidates all essential elements (code scripts, plots, figures, results, and datasets) into a single, manageable environment.
NOTE: Up until now, we've just been doing everything one command at a time, which is not how you'll use RStudio in the real world. That was for demonstration purposes only.
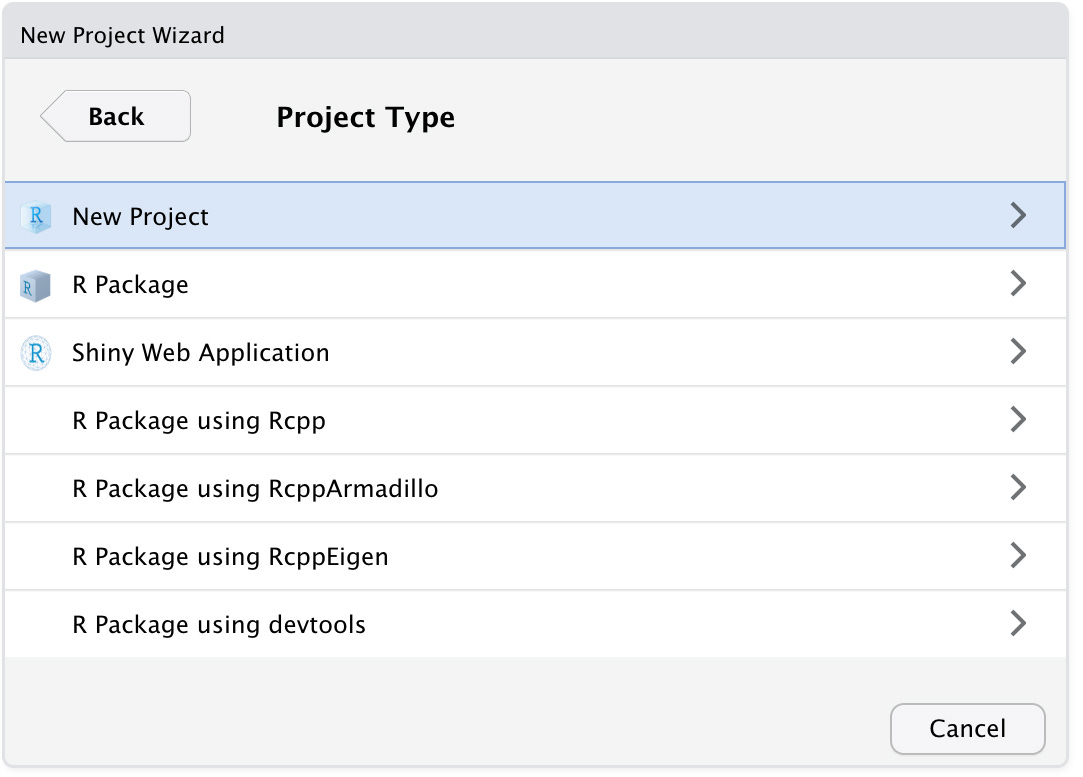
To start a new project, go to the File tab in RStudio, select New Project, and decide whether to create it in a new or existing directory. For this tutorial, create a new directory by choosing New Directory to initiate a new project.
Next, select New Project. This is how you'll create an R project:
Now, name your project. The Create project as a subdirectory of: field shows where the folder will live on the computer once it is created. Pick your desired location and select Create Project. That's it; you just created your first R Project!
Lastly, in RStudio, you'll be able to see the name of your project in the upper-right corner. You'll also see the .Rproj file in the Files tab.
NOTE: Projects are ideal for collaboration. Sharing the .Rproj file you just created with colleagues allows them to access all project components, ensuring they can replicate your work environment and results seamlessly.
Maintain Clean Workspaces
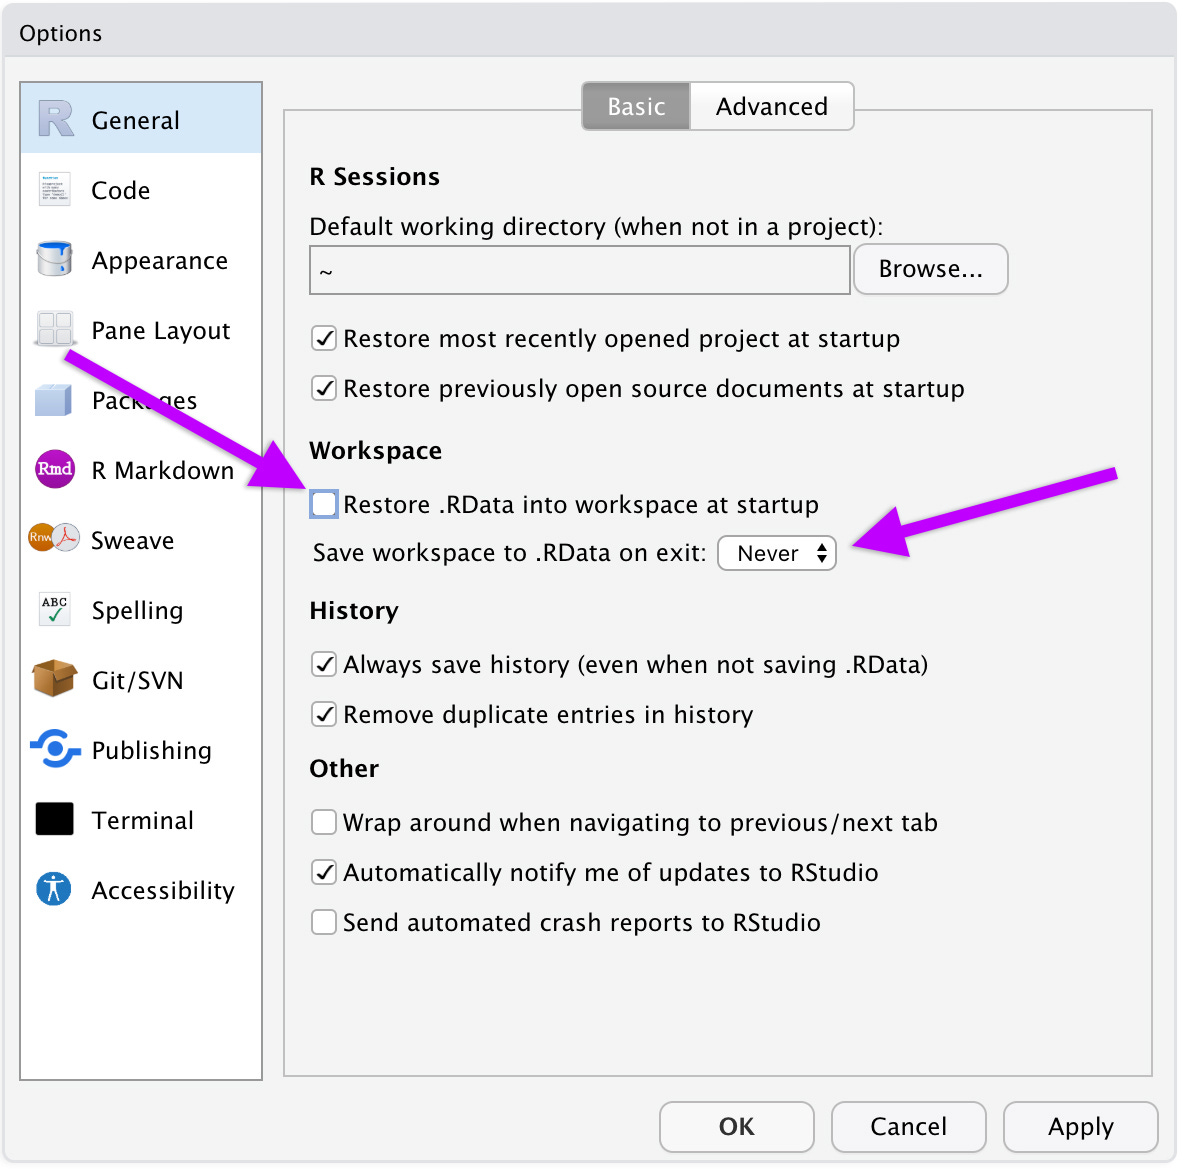
Save important R scripts, but avoid saving the workspace itself to prevent clutter and ensure a fresh start with each session. To stop RStudio from preserving your workspace, go to Preferences > General and deselect the option to restore .RData at startup. Make sure to set your preferences to never save your workspace as follows:
This approach ensures that each RStudio session starts clean, with previously written scripts available to build the environment as needed, following best practices recommended by seasoned R users.
Thats it. All the setup is done! Now, let's start using RStudio for real.
R Scripts and Running Code
As projects get more complex, you'll want to save our work. For that reason, let's no longer use the Consol to enter code like we did earlier. Instead, you'll start writing your code in full script form in the text editor pane at the top left of the interface:
NOTE: This enables you to monitor your project progress, write clear code with extensive notes, replicate your efforts, and share them with others.
To write a new script, go to the File Menu > New File > R Script.
Let's Finally Make Something
For your first new script example, let's create a scatterplot. Copy/paste this code into your text editor pane:
library(ggplot2)
ggplot(data = mpg, aes(x = displ, y = hwy)) + geom_point()
This snippet will plot engine displacement against fuel economy from a built-in mpg dataset, showing trends in how engine size impacts efficiency.
NOTE: This snippet uses data from a built-in mpg dataset included in the ggplot2 package. This particular dataset is popular among R users for demonstration purposes.
Follow these 2 steps to run and save your script.
To execute, just hit Cmd + Enter (Mac) or Ctrl + Enter (Windows/Linux).
To save, navigate to the File menu and select Save. Or just hit Cmd + S (Mac) or Ctrl + S (Windows/Linux)
In this case, you'll need to highlight all the lines of code to generate the scatterplot. To highlight and execute all lines of code in a script, enter:
Mac OS X: Cmd + A + Enter
Windows/Linux: Ctrl + A + Enter
If you did it right, you should see this scatterplot on your screen.
R Markdown: Your Path to Reproducible Reports
For reporting, R Markdown is your best friend in RStudio. It integrates your code, results, and narratives into documents that can be as simple or interactive as needed all n one place. Do this by going to File > New File > R Markdown...
Then, compile your analyses into HTML, PDF, or Word. R Markdown files ensure that your research is reproducible, making your findings more credible and useful. Learn more about R Markdown here.
Try it for Yourself
What is the best way to master RStudio? Dive in and start tinkering. Set up a project, write some code, or google how to write some code like I do, break it, fix it, and learn what each part does. Every complex function started as a simple line of code, and every R expert started precisely where you are right now. Good Luck!
Conclusion
Getting RStudio set up might seem like a bit of a hassle at first, there's R to install, packages to download, and settings to tweak. But trust me, it's worth it once you've got everything up and running. RStudio turns the complex into the accessible, making sophisticated data analysis tasks quick and easy. With its powerful tools for creating visuals, crunching numbers, and sharing interactive insights, RStudio is like a UX research secret weapon once you get the hang of it. So, despite the bit of setup pain, the payoff in leveraging R's capabilities is massive, it really transforms what you can achieve with your data. Dive in, play around, and watch how RStudio changes your approach to UX research for the better!
I hope you found this article helpful. Feel free to comment here or DM me to clarify anything that may be unclear. Thanks all!








Hi Trevor,
I have been following your statistical content and R programming. They are all very interesting and useful resources to advance quant skillsets. I would like to ask - if you have done any choice experiment, asking questions about willingness to pay? Or any similar research questions that assist in making decisions about optimal product packages (across multiple attributes)?
If you can share some knowledge about the discrete choice analysis and the concrete case study, I would really appreciate it!
Thank you.
Best,
Shan
thanks Trevor, for highlighting the importance of RStudio, I find it very useful for analytical research
Can you also point me to some good courses in RStudio available online for UX Research that can enhance my skills